40+ Free Online Tools and Software to Improve Your Workflow
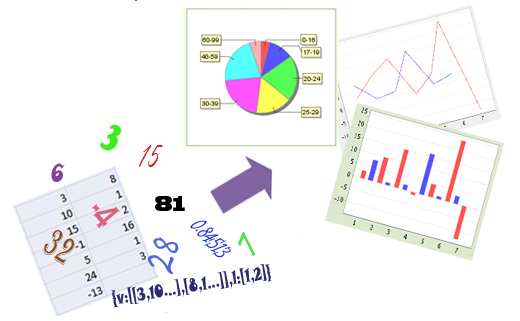
Charts and graphs are the most effective ways to show the relationship between two different and interlinked entities. On a web page, a comprehensively designed flowchart, diagram or graph can be worth a thousand words. Creating such charts that inform your visitors about all the necessary details is a daunting task, and many designers find creating charts, diagram and graphs a difficult job to accomplish.
Here, you will discover some of the best available free web services that let you create copious amounts of charts, diagrams and graphs. A majority of these services are easy to use; and will produce results that will be comparable to what you saw on the screen.
You can also use Filehorse to find the latest free online software.
Enjoy!
The Showcase
ChartDemo
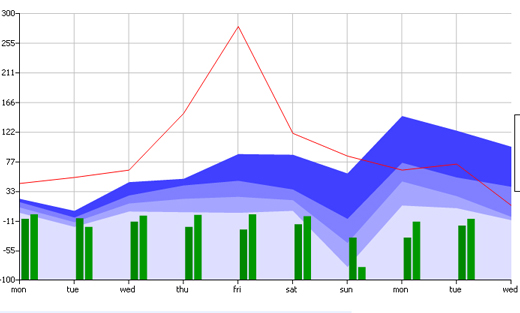
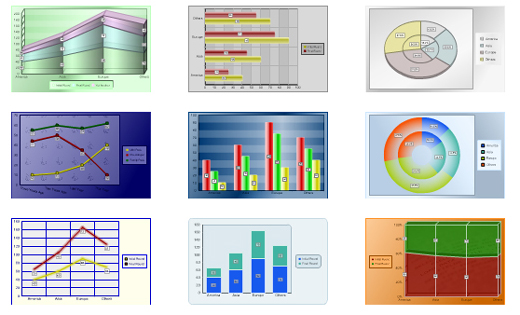
If you need to create a stacked area chart along with complete labels and legends, then ChartDemo is for you.
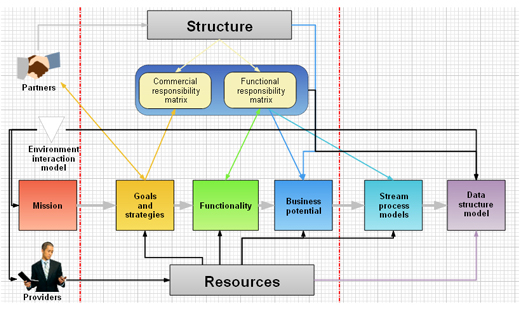
Flowchart
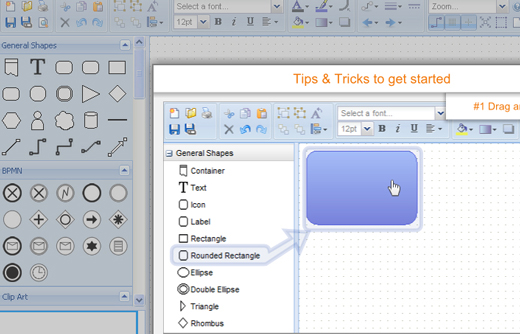
This tool not only lets you create charts and diagrams but also provides you a platform to collaborate with your colleagues. This does not require you to download any software rather it works in your internet browser.
Track-n-graph
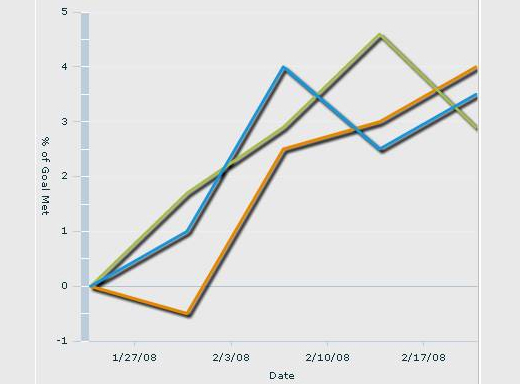
An easy to use web based tool for friends, family and colleagues to track and graph information
Barchart
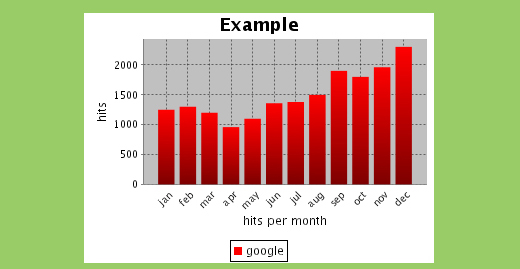
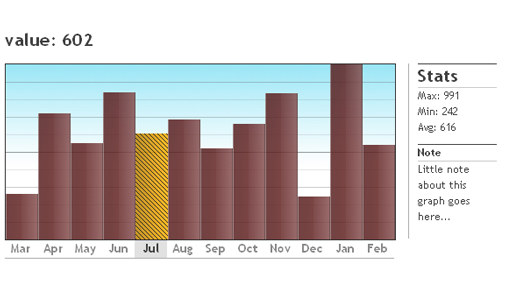
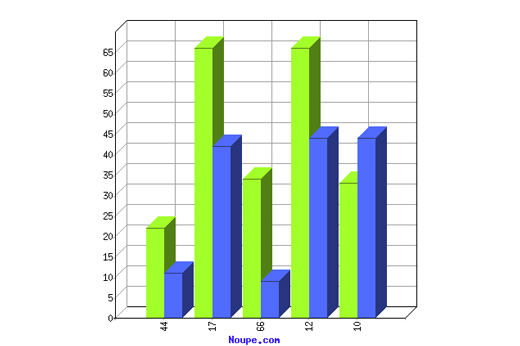
This online tool allows you to create bar charts without the need of an applet bar graph creator. An absolute must have tool for those who want to create bar graphs.
Bubbl
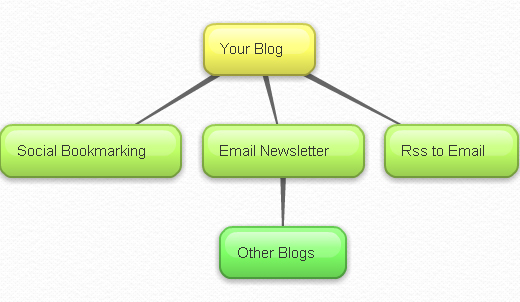
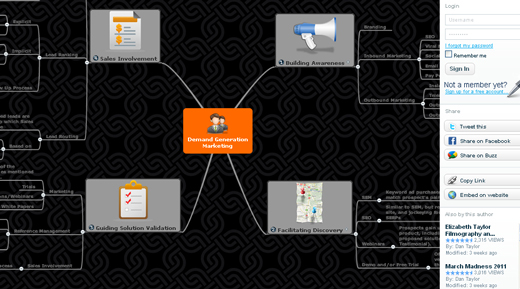
Create multicolored mind maps online, share and work on them with friends. With this tool, you can embed your mind map in your blog or website, can email it or have it in printed form.
ChartGizmo
A free web based application that lets you create charts for your websites, blogs and even for social network profiles.
CreateAGraph
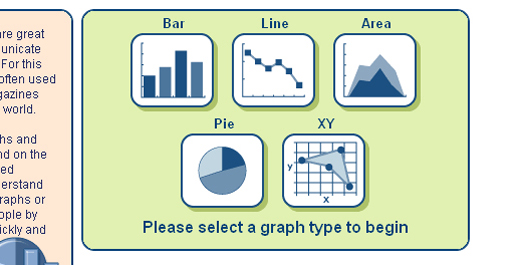
CreateAGraph gives you five different types of graphs and charts that you can consider for your use. With this tool, you can work online right from your browser.
DrawAnywhere
As the name suggests, draw anywhere you like. You can create flowcharts, diagrams, organizational charts and on top of that you can export your charts and diagrams as an image file (jpg, png, pdf, etc).
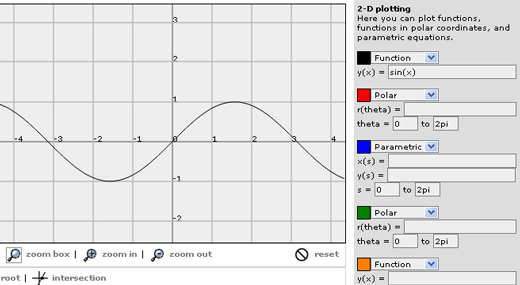
Fooplot
Fooplot is an online tool that lets you create charts & diagrams.
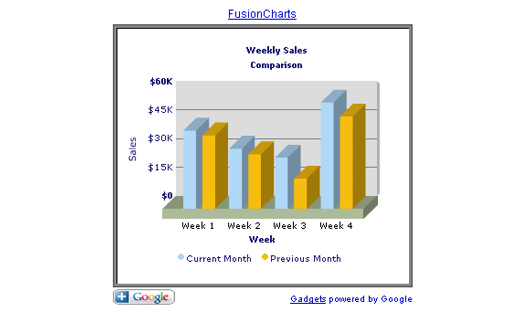
FusionCharts Google Gadget
Another useful web based tool to draw charts and diagrams with ease and comfort.
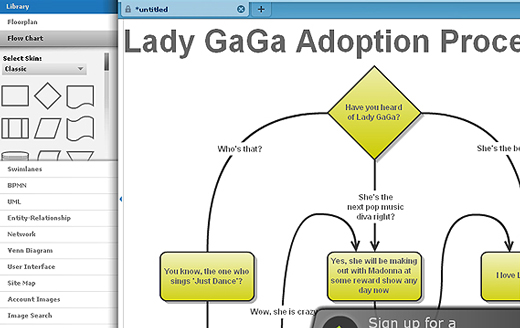
Gliffy
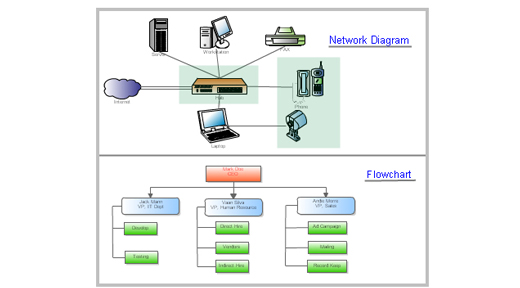
It is online diagramming software that allows you to create professional looking flowcharts, diagrams, floor plans, technical drawings, and more!
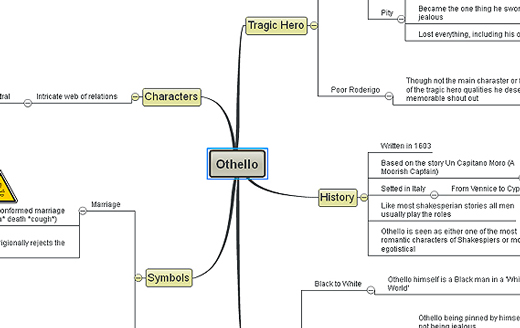
Mindomo
A versatile Web-based mind mapping tool for creating, editing and sharing mind maps. It offers the capabilities of desktop mind mapping software in an internet browser with no installation and maintenance required.
Mindmeister
This tool comes with all the customary features of a typical mind mapping tool with as many concurrent users as you like.
MGraph
MGraph is an online tool with which you can plot simple graphs.
Plotr
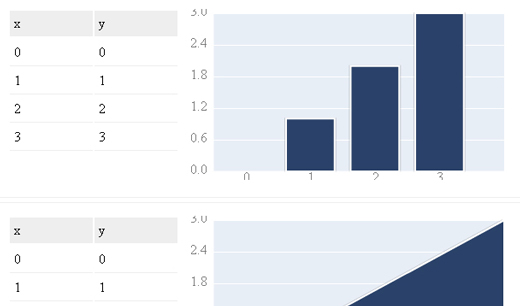
Draw simple charts with this lightweight charting framework which is based on Plot Kit. No use of Flash and no other interactive elements as you don't always need them.
PlotKit
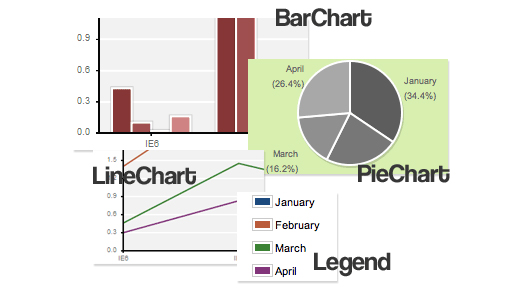
A comprehensive chart and graph plotting library for Javascript that comes with HTML Canvas, native browser and SVG support via SVG viewer.
Rich Chart Live
Use your web browser to create enjoyable and enchanting flash charts. High-impact charts can also be created with this absolutely free online tool.
SimpleSeating
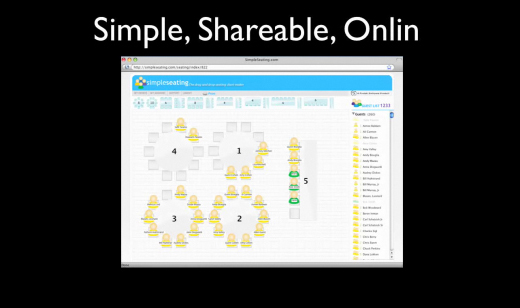
This is an invaluable tool for those who are responsible for planning an analyst event which can be a major time sink and massive pain without it.
Online Chart Generator
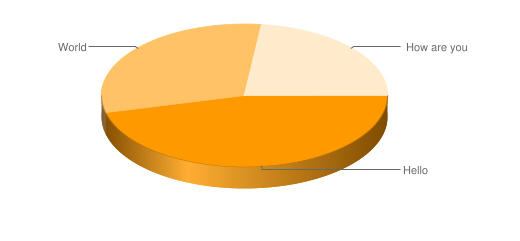
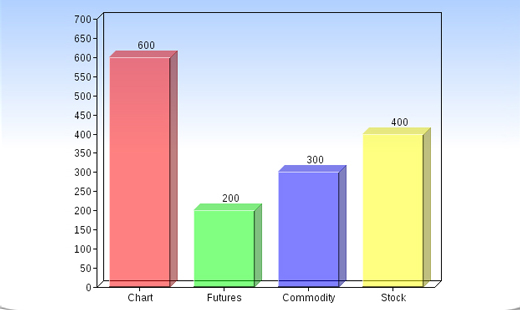
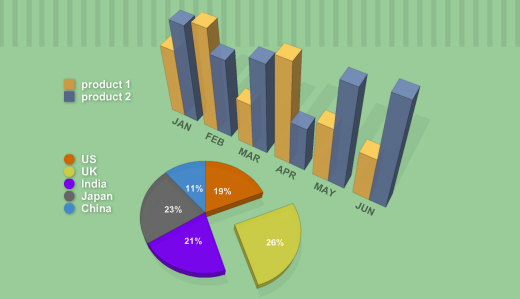
With this online tool, you can create amazing 3D graphs instantaneously.
DIY Chart
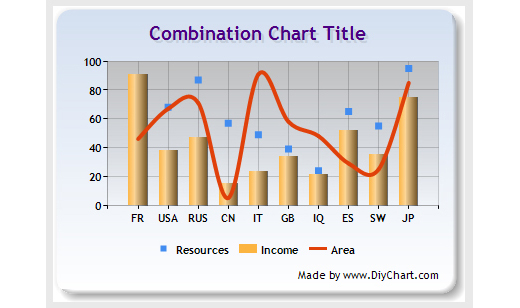
DIY (Do it yourself) Chart is an easy to use, simple yet powerful online tool that can be used to create interactive graphs and charts using static or dynamic data.
Chartle.net
This tool offers simplicity, ubiquity and interactivity to online visualizations, and tears down the complexity so that novices can also use it.
ChartGo
ChartGo permits users to generate charts online rapidly. Simply paste your data in the chart data area and hit the create chart button. It's that easy.
JS Charts
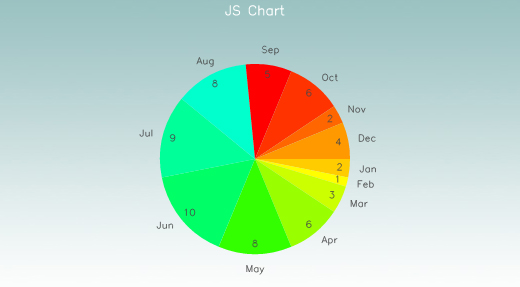
A JavaScript chart generator that lets you create charts in different templates. It is an easy to use tool that requires little or no coding.
Pie Chart Tool
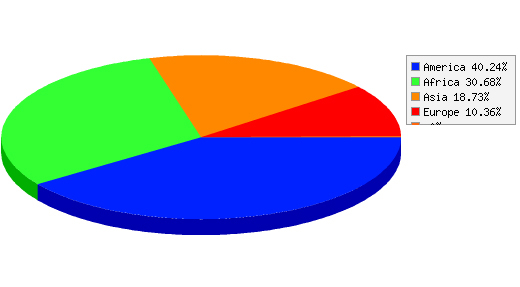
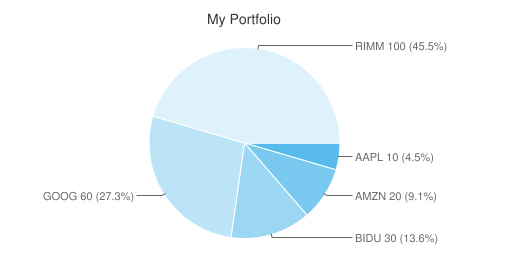
A simple and easy Pie Chart creator that lets you create a pie chart based on the data that you provide. Simply type in your data and the name of the categories.
Piecolor
Piecolor is an online tool to create colorful pie chart with ease.
Hohli Charts
Hohli Charts lets you animatedly create charts.
CSS Chart Generator
Generate your charts on the fly with CSS Chart Generator.
CHARTPART
This is a simple and straightforward online tool for creating charts.
Google Chart Tools
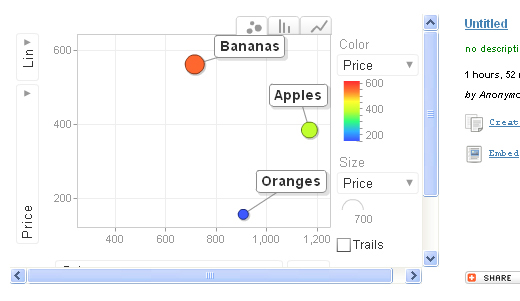
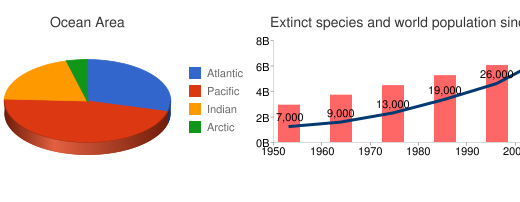
The Google Chart Tools facilitate adding live charts to any web page.
amCharts Visual Editor
You can use amChats as a web service through this editor. Configuring the chart and pasting the generated HTML code to your HTML page is all you need.
Pie Chart Maker
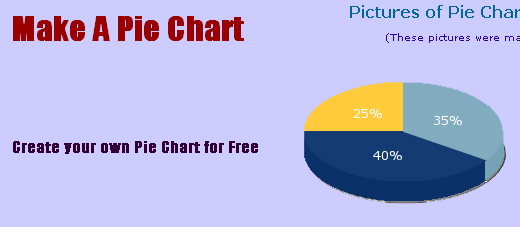
The Pie Chart Maker lets you generate your own customizable pie charts. You can save your pie charts as an image on your computer as well.
Online Chart Tool
This online tool allows you to design and share your own graphs absolutely for free.
OWTChart Generator
The OWTChart Generator is yet another useful online tool that can produce charts. It displays a GIF image of the chart on the screen
Chart Maker
Chart Maker allows users to easily create charts according to their individual needs.
Highcharts
It is a JavaScript library for creating different types of charts including line, spline, area, areaspline, column, bar, pie and scatter charts. It offers an easy way to add interactive charts to your websites and even web applications.
Google Chart Generator
This tool creates a Google chart in seconds!
JGraphpad
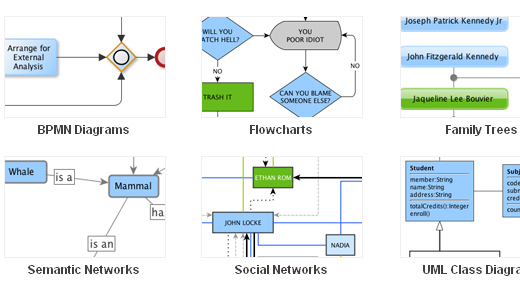
It is a feature-rich, online, standards-compliant and open source graph component available for Java that includes Process diagrams, workflow and BPM visualization, flowcharts, even traffic or water flow etc.
yEd Graph Editor
Another Java based graph editor that lets you generate drawings quickly and effectively. With this tool, you can implement automatic layouts to a wide range of different diagrams and networks.
Graphviz
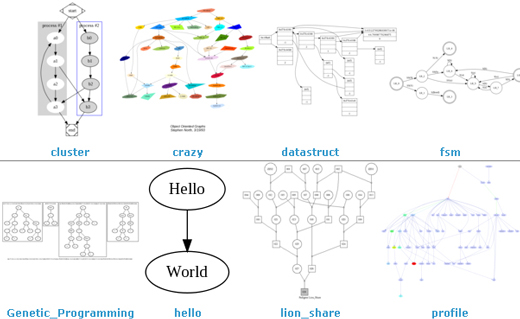
Graphviz is an open source graph visualization software that presents structural information as diagrams of abstract graphs and networks. You can employ this tool in networking, bioinformatics, software engineering, database and web design, machine learning, and in visual interfaces for other technical domains.
XML/SWF Charts
A simple yet powerful online tool that allows you to create beautiful web charts and graphs from dynamic XML data. You can either manually prepare the XML source or can generate it via any scripting language such as PHP, ASP, CFML, Perl, etc.
(rb)

Creative collection. I have forwarded this to our developers for implementing this in our back office report.Thanks for sharing wonderful stuff
If you are looking for a free desktop Mind mapping software, check FreeMind. Works very well on all platforms.
nice article
XMind also works well and is free. I use it all the time. http://www.xmind.net/
I am officially impressed. I see some tools listed here I can recommend to my solo and startup clients to help them get a handle on systems creation for workflow.
Great Collection, bookmarked it for future. Keep it upcoming
Extremely useful resources, was looking something like this, thanks for sharing.
Awesome info as usual
nice collection,
Thank you for this useful collection!
Another addition to your list is dhtmlxChart, a JavaScript charting library that allows you to implement dynamic charts on a website or web app: http://dhtmlx.com/docs/products/dhtmlxChart/